Application of Control Charts to Safety Events
Conference
65th ISI World Statistics Congress
Format: CPS Abstract - WSC 2025
Keywords: data-quality
Session: CPS 68 - Enhancing Data Quality and Governance in Official Statistics
Monday 6 October 5:10 p.m. - 6:10 p.m. (Europe/Amsterdam)
Abstract
Historically, there has been a significant increase in the desire to create and implement a data-driven culture within companies. Terms such as Big Data, Data Science, Data Analysis, have been gaining more ground to support this process of transforming large volumes of data into strategic drivers. With the increasing use of information, the focus on ensuring that the correct data is being presented is becoming even more a priority.
In January 2021, Ilumeo, a data science consultancy, published some interesting statistics on its website: According to Gartner, an average of US$15 million a year is spent on wrong decisions in companies and, according to Experian, 90% of companies are affected by this problem [...]An IBM study revealed that 1/3 of business executives don't trust their data and that, on average, 32% of their data is wrong. Another study, by Forrester, shows that 1/3 of data analysts spend more than 40% of their time reviewing data manually, looking for quality problems because of the lack of trust.
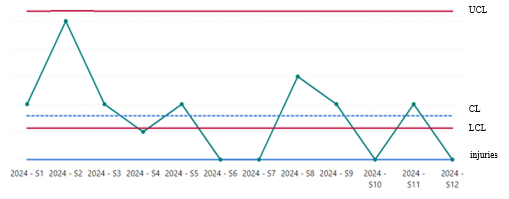
Considering this scenario, Vale - a Brazilian multinational mining company and one of the largest mining companies in the world, with a staff of approximately 185,000 people, has created the Data Quality area, because of the need to clarify the quality and reliability of the Health, Safety, Environment and Operational Risk (HSEOR) data on these issues that exists in the company today. Ensuring the quality of this data also ensures the optimization of time and processes, increasing the chance of good results and reducing the risk of failures. The Control Chart is one of the methods used to achieve this goal. The local safety areas at Vale have been increasingly working on plans to reduce the occurrence of Safety Events. The aim of the corporate quality area is to provide support so that they can understand where to act to prevent a new accident from happening. To this end, the control chart was implemented. Its methodology consists of identifying the acceptable limits for the process under analysis. Two ways of defining these limits were applied: the traditional method which consists of calculating the Upper and Lower Limits according to the behavior of the process; the limits were also defined following the target values stipulated for each area. The second method was more effective in detecting deviations for action. By mapping the weekly behavior of events in each area, it is possible to identify which week is outside the process through an automatic email alerting us about the deviation. After that, it is possible to carry out studies to immediately identify the causes associated, preventing the behavior from continuing for more than a week. By eliminating the identified causes, it will be possible to minimize risks, improve worker safety and protection. The great expectations for the study are to extend the application to other themes in order to achieve greater safety in our operations and to create an environment for sharing the causes already identified so that other areas can use them as learning.
Figures/Tables
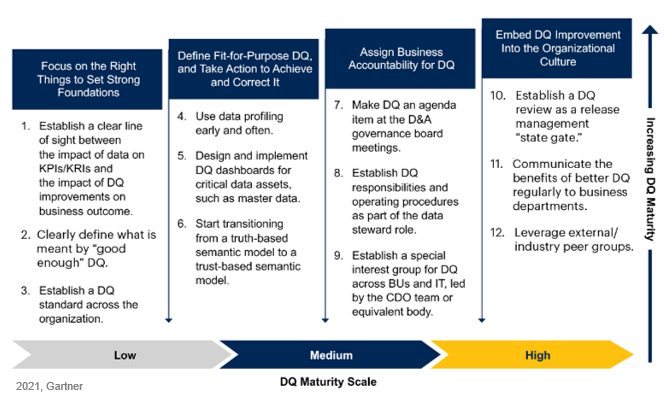
Twelve actions to improve data quality

Control chart structure

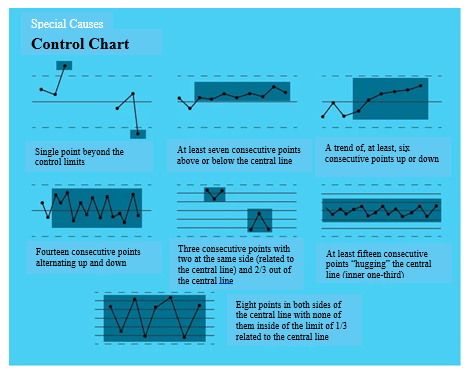
Special Causes

