Slum classification using superpixel and machine learning: A case study in Rio de Janeiro
Conference
65th ISI World Statistics Congress
Format: CPS Abstract - WSC 2025
Keywords: image classification, machine learning, rio de janeiro, slums, superpixel
Session: CPS 73 - Spatial Data and Machine Learning for Urban Development
Monday 6 October 4 p.m. - 5 p.m. (Europe/Amsterdam)
Abstract
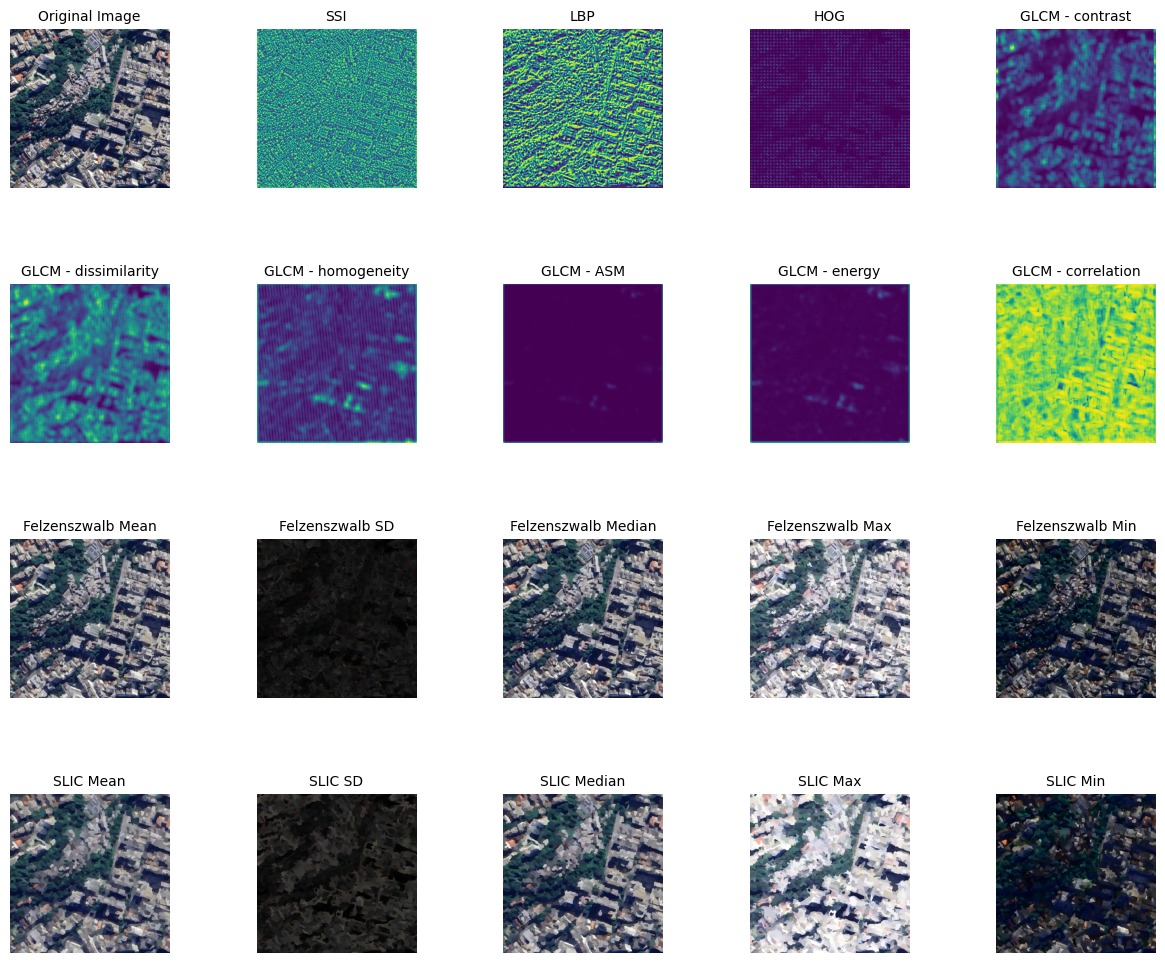
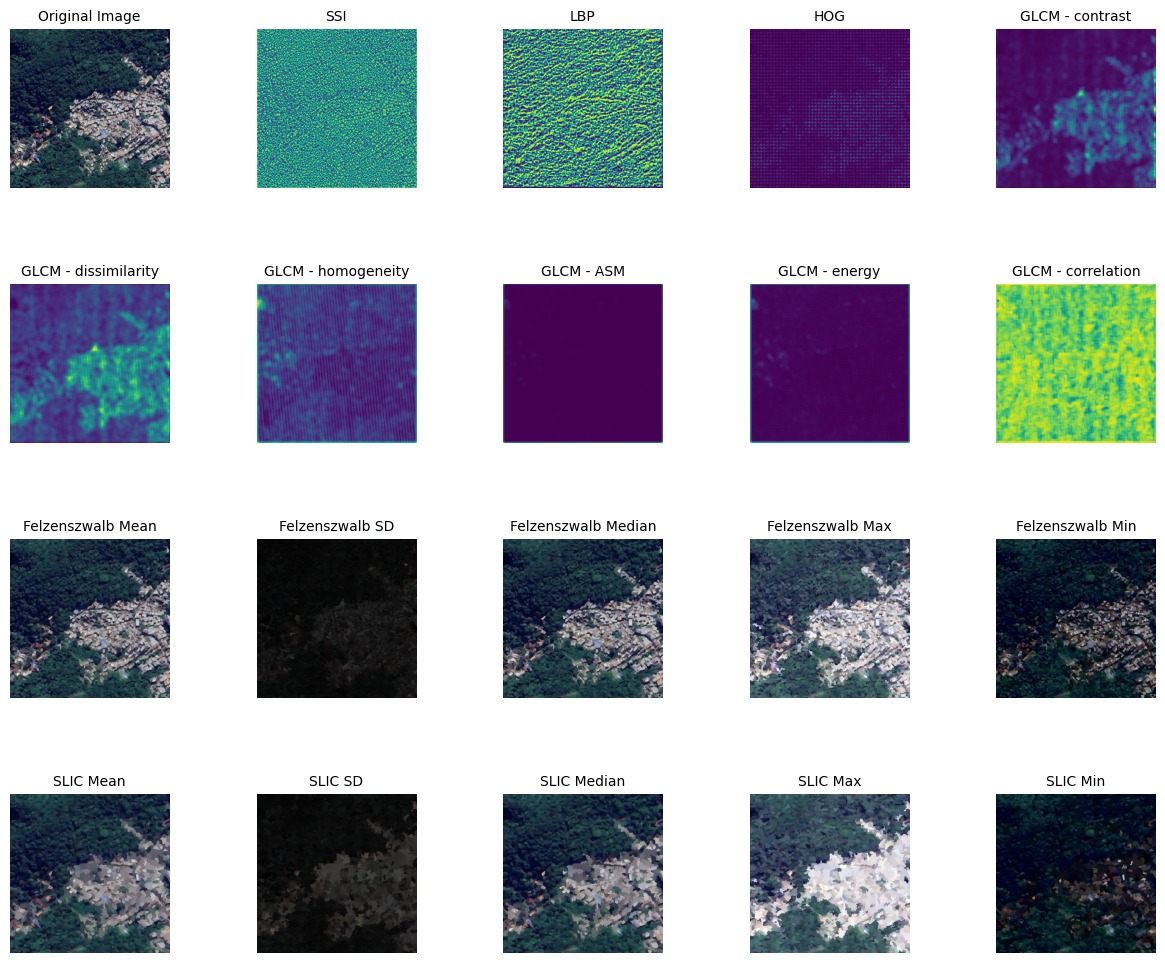
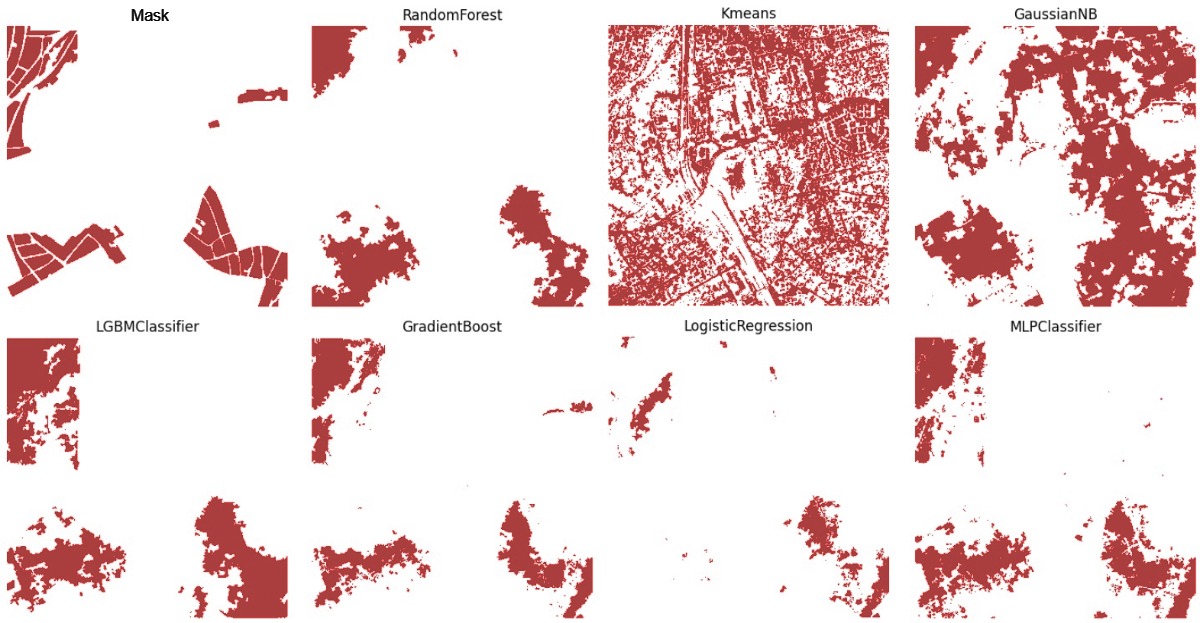
Slums and urban communities have unique characteristics, and to develop appropriate public policies for these areas, it is necessary to monitor their expansion or contraction over time. To overcome the difficulty of obtaining precise and up-to-date data during intercensal periods, we propose using remote sensing data to identify slums and urban communities, using Rio de Janeiro as a case study. The city of Rio de Janeiro is the second largest metropolis in Brazil. In 2010, the city had 763 Slums where about 1.4 million people lived, representing 22% of the state's total population. In 2022, the city of Rio de Janeiro had 41,365 census tracts, with 2,773 classified as slums by the Brazilian Institute of Geography and Statistics (IBGE). To better classify these slums, we divided Rio de Janeiro into 1-square-kilometer areas and randomly selected 135 squares. The selected squares went through a manual labeling process in QGIS, ensuring that all census tracts classified as slums within the area were marked. For a preliminary study, 5 out of the 135 squares were randomly selected and converted into 1000x1000 pixel images to compose the experimental dataset. The selected images underwent preprocessing to adapt them for quantitative analysis and highlight areas of interest. In this context, six image preprocessing techniques were used: Spatial Shape Index, Felzenszwalb's superpixel, SLIC superpixel, Local Binary Patterns, Histogram of Oriented Gradients, and Gray Level Co-occurrence Matrix. The superpixels were used to promote semantic and spatial consistency for pixel-by-pixel classification algorithms. At the end of preprocessing, all features were incorporated into the images as new bands, resulting in images with six bands in addition to the native red, green, and blue (RGB) bands. Subsequently, the images were vectored pixel by pixel, creating vectors of size one million for each image, such that each position in the image vector contained the six bands of the vectored pixel. Image vectorization enables the use of multiple classification algorithms. For this study, XGBoost, LightGBM, MLP Classifier, Random Forest, K-Means, Naive Bayes, and Logistic Regression were used for a binary classification, Slums and not slums. The selection of the best parameters for each model was done using the GridSearchCV method based on F1-Score metric. Performance evaluation for each algorithm was done through cross-validation with 4 images for training and 1 for testing, rotating the training and test image set five times. The preliminary results indicate that XGBoost and LightGBM are the best classifiers, achieving a maximum F1-Score of 57.01% and 56.42%, respectively.
Figures/Tables
Image1 - Pre-processing

Image2 - Pre-processing

Image3 - Mask and predictions

