Students’ attitudes towards statistics and R
Conference
65th ISI World Statistics Congress
Format: CPS Abstract - WSC 2025
Keywords: attitudes, data-skills, statistical teaching
Session: CPS 33 - Statistical Methods in Education
Monday 6 October 4 p.m. - 5 p.m. (Europe/Amsterdam)
Abstract
Statistics courses (in an interdisciplinary program) are not the most popular. Attitudes towards statistics play a role in how engaged and successful students will be in the course.
One of the core parts of statistic courses is that students analyse data using the software R. This can become an additional burden. Previous studies have focused on attitudes towards statistics with R, but only covered R in one or a few items (Counsell & Cribbie, 2020; Tucker et al., 2022). From our perspective, this coverage is not sufficient, as it is a substantial part of our (and many other) courses.
We ask: What are students' attitudes towards statistics taught using the software R?
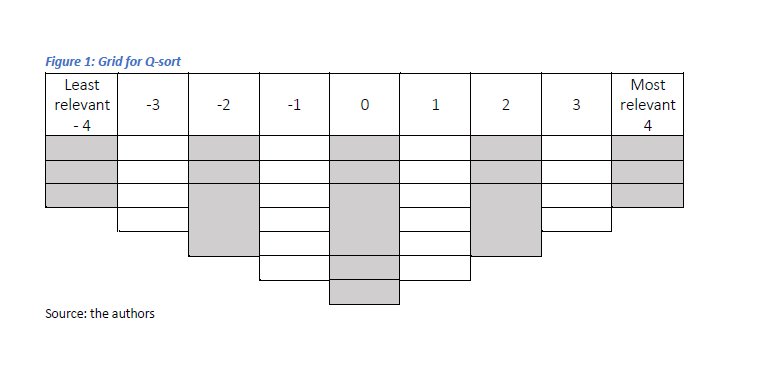
We used the Q-methodology (Brown, 1980). The students (P-set, N=33) sorted sort 34 items (Q-set) between two poles ‘+4: I most agree with…’ and ‘-4: I most disagree with…’. 16 items related to the theoretical understanding of statistics, 12 to the application of statistics in R and 6 to the relationship between theory and application. The items were based on the “Scale to measure attitudes towards statistics” (Schau et al., 1995). The soring took place online (EQ Web Sort, Shawn Banasick). Students were commented on items placed at the two extreme poles of the sorting (+4 and -4). The responses were analysed using the R package qmethod (Zabala, 2014).
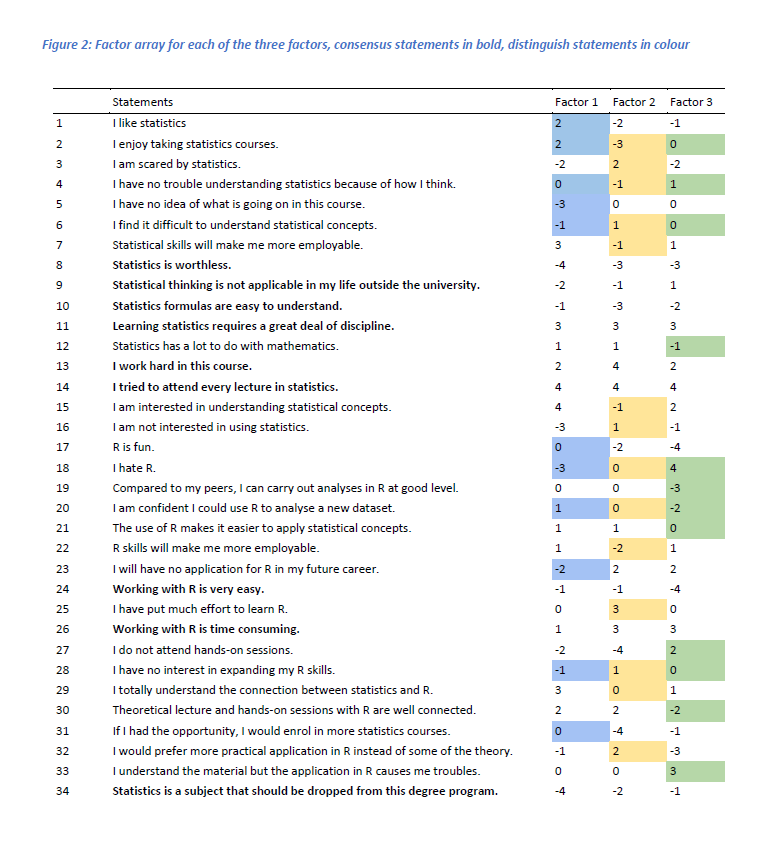
The interpretation of the three factors extracted in the Q-analysis (Varimax, PCA, 64% of the variance explained, 32 of the participants loaded on one of the three factors), complemented by the students' statements on the most extreme items, leads to the following results. The first factor "Statistics for career" represents students (n=16) who are interested in understanding statistical concepts and show a greater affinity with R than other students. They admit that statistics and R are demanding and believe that statistical skills will make them more employable. The second factor "Statistics is hard work" represents students (n=11) who are more afraid of statistics than the others. They do not enjoy the course and do not see statistics and R as a career advantage. However, they put in a lot of effort and time to master the material. The third factor "R is the problem" represents students (n=5) who understand the material but the application in R causes them problems. They do not believe that they can perform analyses in R as well as their peers. They prefer not to attend R sessions. But, they see some potential in statistics and R skills for their future careers.
The three factors are moderately correlated with each other (r between 0.29 and 0.36), pointing some similarities. In all three factors, the items 'I tried to attend every statistics lecture' and 'Learning statistics requires a lot of discipline' ranked high, indicating students' determination to understand the material. All students negated the item ‘Statistics is worthless’. Students' comments showed that although they do not consider statistics to be worthless, they do not see any direct relevance for a civic, personal and professional life.
Figures/Tables
Fig1

Fig2

